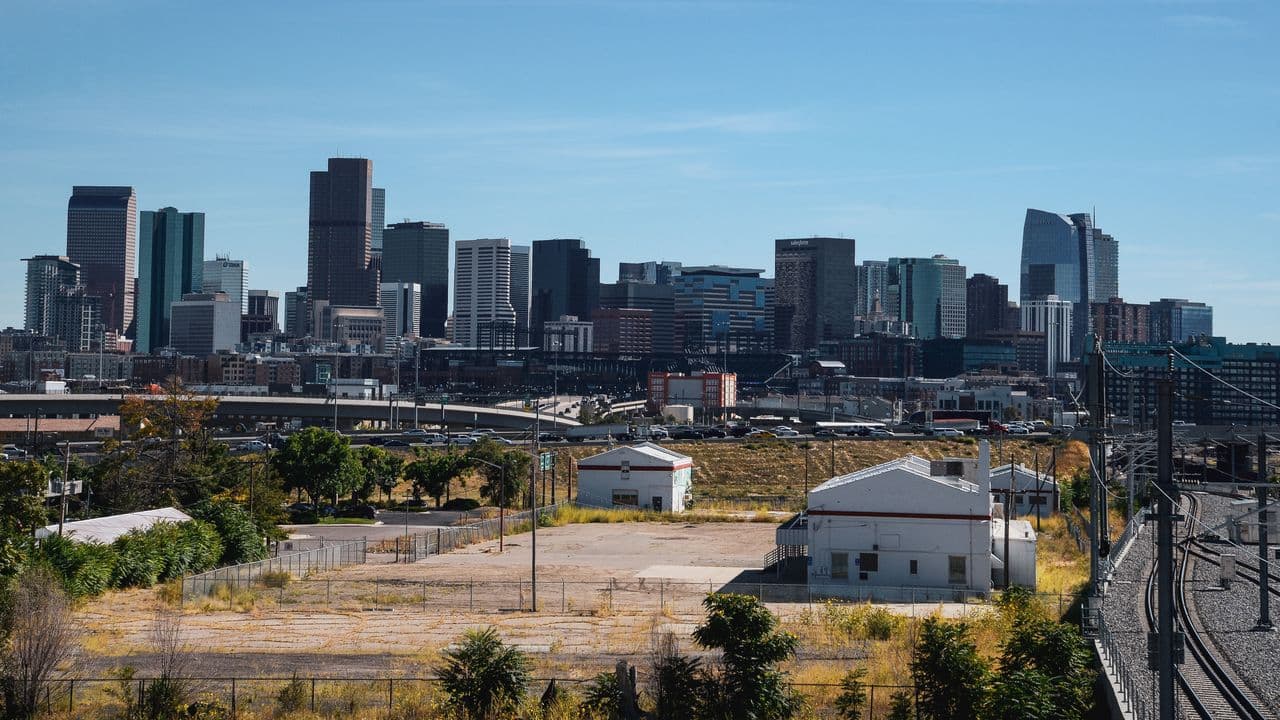
Denver's housing market has shifted from the rapid price growth of earlier years into a more mixed environment. Prices, rents, inventory, and market pace now vary substantially from one neighborhood to another and between Denver and nearby cities such as Aurora, Lakewood, and Arvada.
Denver's current median listing price is about $524,900, with a median sold price of $555,000, median asking rent of $1,690 per month, and 60 median days on market. Zillow places the city's typical home value at about $524,695, down 2.1% over the past year.
This guide compares 10 Denver-area housing markets using the latest publicly available pricing, rental, inventory, and market-activity data.
Disclaimer: The information provided in this guide is for educational purposes only and does not constitute financial, tax, or legal advice. Always consult with a licensed professional before making any financial or investment decisions.
Key Takeaways
Denver's median listing price is $524,900, down 7.31% year over year, while its $555,000 median sold price is down 3.48%
Entry prices vary widely, from a $295,000 median listing price in Capitol Hill to nearly $1.4 million in Washington Park
Rental markets are moving in different directions, with year-over-year asking-rent gains in areas such as LoHi, Cherry Creek, Sunnyside, and Lakewood and declines in several other neighborhoods
Nearby cities broaden the price range, with Aurora at $449,000, Lakewood at $525,000, and Arvada at $616,500 in current median listing prices
Denver rental regulations matter, with licensing requirements for residential rentals and a primary-residence requirement for short-term rentals
Understanding Denver's Current Housing Market
Denver currently has 4,262 active for-sale listings, up 6.15% from a year earlier. The city also has 3,231 rental properties represented in Realtor.com's current dataset, up 6.99% year over year.
At the same time, the median listing price is down 7.31%, the median sold price is down 3.48%, and median asking rent is down 4.14%. Realtor.com currently classifies Denver as a balanced housing market.
Zillow's separate Home Value Index tells a similar story of modest cooling. Its latest data places Denver's typical home value at $524,695, down 2.1% over the past year. Listing-price changes and home-value changes measure different things, so the sections below keep those metrics separate.
1) Capitol Hill
Median Listing Price: About $295,000
Typical Rent: About $1,205 per month
Year-over-Year Listing Change: Down 9.03%
Days on Market: 65 days
Capitol Hill currently has one of the lowest median listing prices among the central Denver neighborhoods covered in this guide. Its housing stock includes condos, apartments, historic homes, and smaller multifamily properties close to downtown.
Investment Profile
Median sold price: $325,000
Price per square foot: $368
Active listings: 127
Rental properties: 391
Rental trend: Median asking rent is down 5.49% year over year
Market status: Realtor.com currently classifies Capitol Hill as a buyer's market
Why Capitol Hill Made the List
Capitol Hill combines a central location with one of the Denver neighborhoods' largest pools of active rental listings. Its mix of condominiums and multifamily housing also gives the neighborhood a substantially lower headline listing-price median than nearby single-family-heavy areas.
The neighborhood sits immediately east of downtown and includes dense residential blocks alongside restaurants, shops, offices, and civic institutions. That urban housing mix makes Capitol Hill distinct from higher-priced neighborhoods such as Washington Park and Cherry Creek.
2) Five Points
Median Listing Price: About $519,000
Typical Rent: About $1,922 per month
Year-over-Year Listing Change: Down 16.25%
Days on Market: 72 days
Five Points is a historic central Denver neighborhood northeast of downtown. The area includes older homes, rowhouses, condos, apartments, and newer infill development, with parts of the broader River North arts and entertainment area extending through the surrounding district.
Investment Profile
Median sold price: $515,000
Price per square foot: $423
Active listings: 154
Rental properties: 128
Rental trend: Median asking rent is down 18.07% year over year
Market status: Realtor.com currently classifies Five Points as a buyer's market
Why Five Points Made the List
Five Points combines historic residential streets with some of Denver's most visible urban redevelopment. Its position between downtown, RiNo, Curtis Park, and other central neighborhoods gives it a varied property mix that ranges from older detached homes to newer attached housing and multifamily development.
Current pricing has softened considerably from a year ago, while the neighborhood still carries a median listing price close to Denver's citywide level.
3) LoHi
Median Listing Price: About $870,000
Typical Rent: About $3,320 per month
Year-over-Year Listing Change: Down 12.56%
Days on Market: 67 days
LoHi, or Lower Highland, sits just northwest of downtown Denver across I-25. Its residential mix includes renovated older homes, townhomes, condos, and newer infill construction alongside a dense restaurant and retail district.
Investment Profile
Median sold price: $782,000
Price per square foot: $505
Active listings: 90
Rental properties: 46
Rental trend: Median asking rent is up 27.94% year over year
Current pricing: LoHi's listing median remains well above Denver's citywide median
Why LoHi Made the List
LoHi pairs direct access to central Denver with a distinctly residential neighborhood setting. Its housing tends to occupy a higher price tier than Capitol Hill or Five Points, while its current rental median is also substantially higher.
The latest data shows lower listing and sold-price medians than a year ago alongside a sharply higher median asking rent. With only 46 rentals represented in the current dataset, individual property characteristics can have a noticeable effect on the neighborhood's rental statistics.
4) LoDo
Median Listing Price: About $650,000
Typical Rent: About $3,000 per month
Year-over-Year Listing Change: Down 11.57%
Days on Market: 84 days
Lower Downtown, or LoDo, is part of Denver's historic urban core. The neighborhood is centered around a dense mix of residential buildings, offices, restaurants, entertainment venues, and transportation connections around Union Station.
Investment Profile
Median sold price: $572,500
Price per square foot: $507
Active listings: 130
Rental properties: 48
Rental trend: Median asking rent is down 9.09% year over year
Market status: Realtor.com currently classifies LoDo as a buyer's market
Why LoDo Made the List
LoDo offers one of the most urban residential environments in Colorado, with much of its housing concentrated in condos, lofts, and multifamily buildings rather than detached homes.
Its $650,000 listing median sits above Denver's citywide figure, while a $3,000 current rental median reflects the neighborhood's downtown location and property mix. Homes are also spending a median of 84 days on the market, longer than Denver overall.
5) Cherry Creek
Median Listing Price: About $1.275 million
Typical Rent: About $3,561 per month
Year-over-Year Listing Change: Down 12.21%
Days on Market: 77 days
Cherry Creek occupies Denver's premium residential and commercial segment, with luxury condos, townhomes, newer construction, and high-value single-family properties surrounding the Cherry Creek North district.
Investment Profile
Price per square foot: $462
Active listings: 92
Rental properties: 42
Rental trend: Median asking rent is up 13.05% year over year
Market status: Realtor.com currently classifies Cherry Creek as balanced
Current price tier: The neighborhood's listing median is more than twice Denver's citywide median
Why Cherry Creek Made the List
Cherry Creek combines high-value residential property with one of Denver's largest concentrations of upscale retail, dining, offices, and services outside downtown.
Its property market is substantially different from lower-cost neighborhoods such as Capitol Hill or Five Points. Current listing prices are lower than a year ago, while median asking rent has increased, producing a distinctly different market profile from much of central Denver.
6) Washington Park
Median Listing Price: About $1.395 million
Typical Rent: About $4,450 per month
Year-over-Year Listing Change: Down 25.55%
Days on Market: 58 days
Washington Park surrounds one of Denver's best-known urban parks and contains a substantial stock of older single-family homes alongside renovated properties, duplexes, townhomes, and some multifamily housing.
Investment Profile
Price per square foot: $547
Active listings: 70
Rental properties: 12
Rental trend: Median asking rent is down 8.15% year over year
Market status: Realtor.com currently classifies Washington Park as balanced
Current price tier: It has the highest median listing price among the locations covered in this guide
Why Washington Park Made the List
Washington Park's housing market is shaped by its namesake park, established residential streets, proximity to central Denver, and relatively high concentration of valuable single-family homes.
The current rental dataset contains only 12 properties, so its $4,450 median rent reflects a small pool of available rentals and can move substantially as listings change. Its high purchase-price level also separates it clearly from Denver's condo-heavy urban neighborhoods.
7) Sunnyside
Median Listing Price: About $687,250
Typical Rent: About $3,250 per month
Year-over-Year Listing Change: Down 20.11%
Days on Market: 57 days
Sunnyside sits northwest of downtown near Highland and the broader north Denver residential corridor. Its housing includes older detached homes, renovated properties, duplexes, townhomes, and newer infill construction.
Investment Profile
Median sold price: $810,000
Price per square foot: $430
Active listings: 81
Rental properties: 22
Rental trend: Median asking rent is up 12.11% year over year
Market pace: Median days on market are down 35.71% from a year earlier
Why Sunnyside Made the List
Sunnyside provides a primarily residential setting close to LoHi and central Denver while maintaining a housing mix that differs from the condo-heavy downtown neighborhoods.
Its latest data shows lower asking prices than a year ago alongside higher median rents. Current rental inventory is relatively small, with 22 properties represented in Realtor.com's September dataset.
8) Aurora
Median Listing Price: About $449,000
Typical Rent: About $1,950 per month
Year-over-Year Listing Change: Down 3.44%
Days on Market: 56 days
Aurora is a separate city within the Denver metropolitan area and currently carries a lower median listing price than Denver proper. Its housing ranges from older neighborhoods close to the Denver boundary to newer suburban development farther east.
Investment Profile
Median sold price: $465,494
Price per square foot: $229
Active listings: About 2,100
Rental properties: 771
Rental trend: Median asking rent is down 7.01% year over year
Healthcare anchor: The Anschutz Medical Campus is one of the region's largest concentrations of healthcare, education, and research activity
Why Aurora Made the List
Aurora combines a lower citywide purchase-price benchmark than Denver with a large and diverse housing inventory. The city also contains the Anschutz Medical Campus, which entered 2026 with nearly 5,700 staff, more than 7,100 faculty, and more than 4,600 students.
Housing around Aurora varies significantly by ZIP code and neighborhood, so its citywide $449,000 median covers several very different residential segments. That range is part of what distinguishes Aurora from Denver's smaller central neighborhoods.
9) Lakewood
Median Listing Price: About $525,000
Typical Rent: About $1,675 per month
Year-over-Year Listing Change: Down 6.14%
Days on Market: 51 days
Lakewood sits directly west of Denver in Jefferson County. Its housing includes established single-family neighborhoods, condos, townhomes, apartment communities, and residential areas stretching toward the foothills.
Investment Profile
Median sold price: $580,000
Price per square foot: $280
Active listings: 728
Rental properties: 481
Rental trend: Median asking rent is up 1.52% year over year
Market status: Realtor.com currently classifies Lakewood as balanced
Why Lakewood Made the List
Lakewood combines direct access to Denver with a more suburban housing profile and proximity to the western metro's employment, recreation, and transportation corridors.
Its current $525,000 listing median is almost identical to Denver's citywide figure, but its property mix is considerably different. Listing prices are lower than a year ago, while the median sold price and asking rent are both modestly higher.
10) Arvada
Median Listing Price: About $616,500
Typical Rent: About $2,284 per month
Year-over-Year Listing Change: Down 4.61%
Days on Market: 45 days
Arvada sits northwest of Denver and combines established residential neighborhoods with newer housing, commercial centers, and the Olde Town district. It also has direct rail connections into central Denver.
Investment Profile
Median sold price: $605,000
Price per square foot: $277
Active listings: 794
Rental properties: 189
Rental trend: Median asking rent is down 4.71% year over year
Market pace: 45 median days on market, the shortest among the three suburban cities in this guide
Why Arvada Made the List
Arvada provides a primarily suburban housing environment while remaining connected to Denver's employment and transportation network. Its mix includes older single-family neighborhoods, newer subdivisions, townhomes, and apartments.
Its $616,500 median listing price is currently higher than both Denver and Lakewood, while its median sold price is $605,000. Homes also spend fewer median days on market than in Denver, Aurora, or Lakewood.
What Denver's Current Data Shows
The latest numbers show substantial variation within the Denver area rather than one uniform market.
Central neighborhoods span everything from Capitol Hill's $295,000 median listing price to Washington Park's $1.395 million. Current asking rents also range widely, from $1,205 in Capitol Hill to $4,450 in Washington Park, although rental inventory is much smaller in some of the higher-priced neighborhoods.
Recent price movement is generally softer. All 10 locations in this guide currently show lower year-over-year median listing prices, although sold-price and rental trends vary by area.
Denver itself also has more active for-sale and rental inventory than a year ago. That makes current property-level pricing, rent, expenses, property type, and local regulations more informative than generalized neighborhood yield or cap-rate estimates.
Denver Rental Rules to Know
Denver distinguishes between long-term residential rentals and short-term rentals.
For Denver's long-term rental market, owners must obtain a residential rental license for qualifying properties. The requirement covers single-family homes, individual condominium and rowhouse units, and multi-unit residential rental properties.
Denver's short-term rental rules are different. Under the city's short-term rental rules, a short-term rental must be operated at the license holder's primary residence. Short-term rentals cover guest stays of fewer than 30 consecutive days.
How mogul Connects to Denver Real Estate Investing
The Denver-area markets above range from lower-priced central condos to seven-figure residential neighborhoods and large suburban housing markets. That variety makes individual-property analysis especially valuable.
If you want exposure to U.S. residential real estate through specific properties, mogul provides fractional access to professionally managed rental properties selected through a structured diligence process.
Institutional Real Estate Experience
mogul was founded by former Goldman Sachs real estate professionals with more than $10B in real estate experience.
Its property-selection process includes:
Market and neighborhood research
Financial underwriting
Property inspections
Acquisition analysis and negotiations
Investment-committee review
Less than 1% of properties reviewed by mogul pass the full diligence process.
Invest in Specific Properties
Each mogul property is held through a property-specific investment-club LLC. You can select individual properties and purchase fractional membership interests associated with the entity that owns that residential asset.
This keeps your investment connected to an identifiable property. The guide to fractional real estate explains the ownership structure in more detail.
Analyze Individual Properties
Denver's neighborhood-level data shows how quickly prices and rents can change across only a few miles. Individual properties can also differ in financing, taxes, insurance, maintenance costs, HOA expenses, rental income, and operating assumptions.
With mogul's investment property calculator, you can model a specific U.S. address and examine those inputs at the property level.
Professional Property Management
mogul works with professional property management to handle leasing, tenant coordination, maintenance, and day-to-day property operations.
Once a property is operational and has distributable net rental income, available income is generally distributed monthly according to property performance and ownership interests.
mogul at a Glance
Invested on platform: More than $100M
Community: More than 50K members
Portfolio scale: More than 600 units
Historical performance: 18.8% average IRR across platform assets
Experience: More than $10B in real estate experience across the founding team
Historical performance does not guarantee future investment results.
First-Year Loss Protection
If you're a qualifying new member, you can receive up to $10,000 loss protection on qualifying investments made during your first seven days.
If the aggregate total return on those qualifying investments is negative after the first year, mogul can cover the eligible loss up to $10,000 from its own balance sheet, subject to the applicable promotion terms.
Disclaimer: The information provided in this guide is for educational purposes only and does not constitute financial, tax, or legal advice. Always consult with a licensed professional before making any financial or investment decisions.
Frequently Asked Questions
What is Denver's current median listing price?
Denver's current median listing price is about $524,900, with a median sold price of $555,000 and median asking rent of $1,690 per month. Realtor.com's September 2026 data shows the median listing price down 7.31% and the median sold price down 3.48% from a year earlier.
Which area in this guide has the lowest current listing price?
Capitol Hill has the lowest median listing price among the 10 markets covered here at about $295,000. Its housing mix includes a substantial number of condos and attached properties, so that median should be interpreted alongside property type rather than directly compared with neighborhoods dominated by detached single-family homes.
Are Denver home values rising or falling?
Zillow's latest Home Value Index places Denver's typical home value at about $524,695, down 2.1% over the past year. Realtor.com's separate September data shows the city's median listing price down 7.31% and median sold price down 3.48% year over year, although these metrics measure different aspects of the housing market.
Can a Denver investment property operate as a short-term rental?
Denver generally limits short-term rentals to a person's primary residence. Under the city's short-term rental rules, guest stays are considered short-term when they last fewer than 30 days. Properties rented for longer stays fall under Denver's separate residential rental framework.
How can fractional real estate fit into Denver property research?
Fractional real estate gives you another way to access individual residential properties while professional teams handle property operations. mogul lets members select specific properties through property-level LLC structures, review underwriting information, and build exposure across multiple residential assets while retaining visibility into the properties associated with each investment.