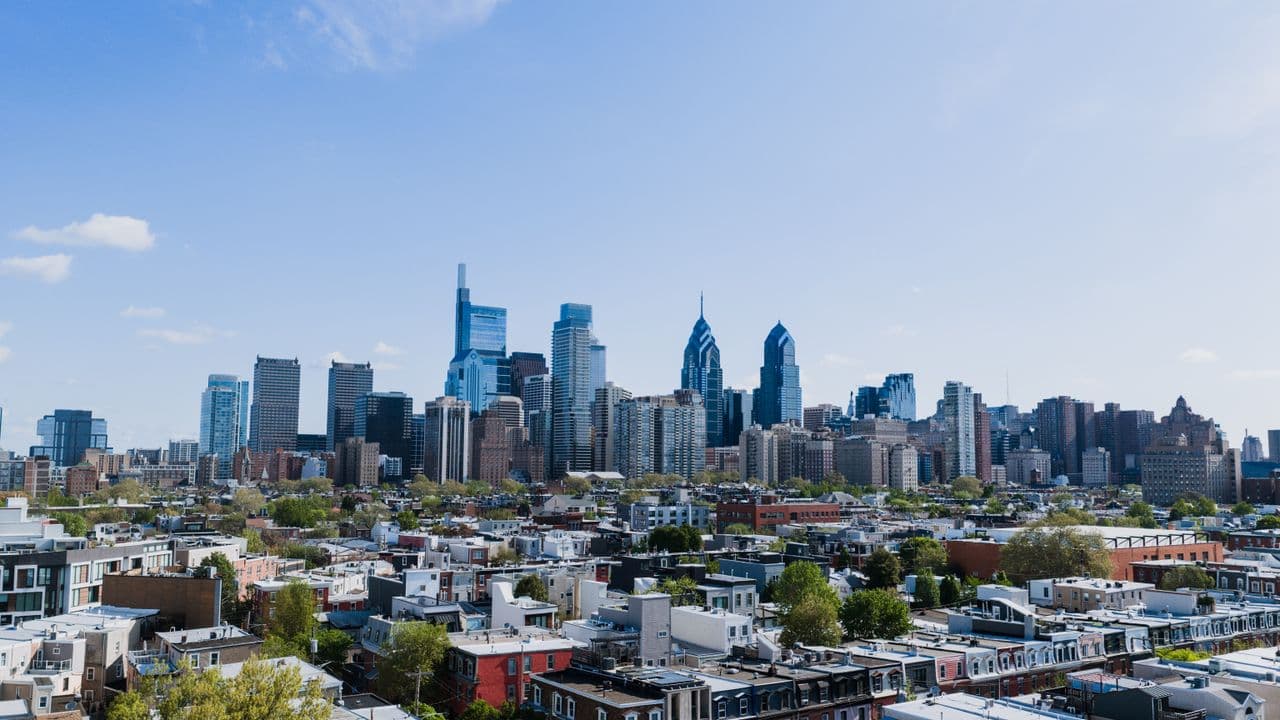
Philadelphia offers a wide range of real estate markets within a single city. The Philadelphia housing market had a median listing price of about $260,000 and a median rent of $1,775 per month in September 2026, with neighborhood-level prices varying substantially depending on location, property type, and housing stock.
That variation creates distinct market profiles across Philadelphia. This guide compares current pricing, rental conditions, transaction activity, institutional employment, amenities, and development characteristics across 10 neighborhoods. Listing prices, sold prices, rents, and year-over-year changes measure different parts of the market, so each metric is most useful within its specific context.
Disclaimer: The information provided in this guide is for educational purposes only and does not constitute financial, tax, or legal advice. Always consult with a licensed professional before making any financial or investment decisions.
Key Takeaways
Philadelphia spans a wide range of price points, with a citywide median listing price of about $260,000 but substantially higher medians in neighborhoods such as Northern Liberties and Passyunk Square
Point Breeze recorded recent transaction growth, with its three-month median sale price rising 8.8% year over year through August 2026
University City has a large institutional employment base, with four medical institutions accounting for just under 52% of jobs in the district
Brewerytown and Port Richmond sit among the lower-priced markets in this comparison, based on current listing and sale-price measures
Property-level economics include local taxes and operating rules, including Philadelphia's 1.3998% tax rate
Why Philadelphia Draws Real Estate Investment Interest
Philadelphia combines a large residential market with major education, healthcare, research, and employment institutions. The city also contains distinct submarkets ranging from lower-priced rowhouse neighborhoods to established Center City districts, creating different ways to evaluate cash flow, property appreciation, acquisition price, and rental activity.
Current conditions make neighborhood-level analysis especially useful. Philadelphia's citywide figures provide a starting point, but they can mask substantial differences in home prices, rental inventory, market pace, and property types from one neighborhood to another.
Operating costs and regulations also affect property economics. Philadelphia's Real Estate Tax rate is 1.3998% of assessed property value, and the city says the rate will remain unchanged in 2027. Philadelphia's August 2026 short-term rental rules explain that these properties generally require a Commercial Activity License, zoning approval, and a Limited Lodging Operator License or another required rental license depending on the property and use.
1) Point Breeze
Median Listing Price: $345,000
Median Rent: $2,000/month
3-Month Median Sale Price (through August 2026): $372,820
3-Month Median Sale-Price Change: +8.8% year over year
Point Breeze combines traditional South Philadelphia rowhouse blocks with renovated properties and newer infill development. Its September 2026 market profile shows a median listing price of $345,000, median rent of $2,000, and median listing price per square foot of $246.
Investment Profile
Listing price per square foot: about $246
Median asking rent: $2,000
Median days on market: 55
Mix of traditional rowhomes, renovated properties, and newer infill development
Why It Made the List
Point Breeze combines a mid-range Philadelphia acquisition price with proximity to Center City and other South Philadelphia employment and amenity corridors.
Recent transaction data provide another market indicator. The neighborhood's three-month sale price reached approximately $372,820 through August 2026, an 8.8% increase from the comparable period a year earlier. That figure describes the three-month transaction period rather than a single-month median or a forecast of future appreciation.
2) Fishtown
Median Listing Price: $475,000
Median Rent: $1,900/month
3-Month Median Sale Price (through August 2026): $467,274
3-Month Median Sale-Price Change: +9.9% year over year
Fishtown combines dense residential blocks with an established mix of restaurants, retail, arts, nightlife, and live entertainment. Its September 2026 housing profile shows a median listing price of $475,000, median rent of $1,900, and median listing price per square foot of $314.
Investment Profile
Listing price per square foot: about $314
Median asking rent: $1,900
Median days on market: 45
Established restaurant, entertainment, retail, and arts infrastructure
Why It Made the List
Fishtown's existing amenity base distinguishes its current market profile from neighborhoods where redevelopment is still a larger part of the local housing story. Restaurants, shops, nightlife, galleries, and music venues are already embedded throughout the neighborhood.
Recent transaction data also show active sales movement. The three-month sale price reached approximately $467,274 through August 2026, up 9.9% from the comparable period a year earlier.
3) University City
Median Listing Price: $375,000
Median Sold Price: $342,500
Median Rent: $1,795/month
Median Days on Market: 71
University City's September 2026 housing data show a $375,000 median listing price, a $342,500 median sold price, median rent of $1,795 per month, and a $238 median listing price per square foot.
Investment Profile
Listing price per square foot: about $238
Median asking rent: $1,795
Median days on market: 71
144 active listings
577 rental properties
Major education anchors include the University of Pennsylvania and Drexel University
Healthcare institutions include the Hospital of the University of Pennsylvania, Penn Presbyterian Medical Center, and Children's Hospital of Philadelphia
Why It Made the List
University City combines more than 53,000 residents with an employment base exceeding 84,000 jobs. Nearly 30,000 residents are students enrolled at local universities, while more than 51,000 students are enrolled across the district's higher-education institutions.
Medical institutions account for just under 52% of University City jobs. Together, the residential, university, healthcare, and employment figures give the district a distinctly institution-heavy profile without assuming that specific occupational groups necessarily live within the neighborhood.
4) Brewerytown
Median Listing Price: $275,000
Median Sold Price: $303,500
Median Rent: $1,697/month
Median Days on Market: 66
Brewerytown occupies one of the lower current listing-price tiers among the neighborhoods in this guide. Its September 2026 housing data show a $275,000 median listing price, a $303,500 median sold price, median rent of $1,697 per month, and a $206 median listing price per square foot.
Investment Profile
Listing price per square foot: about $206
Median asking rent: $1,697
Median days on market: 66
154 active listings
108 rental properties
Mix of traditional residential stock and converted or newer housing
Why It Made the List
Brewerytown remains one of the lower-priced neighborhoods in this comparison based on its current median listing price. In September 2026, the median listing price was down 15.37% year over year, while the median sold price increased 8.39%.
Active listings increased 23.08% year over year to 154, while median rent was $1,697 per month, down 1.62% from the comparable period a year earlier.
5) Olde Kensington
Median Listing Price: $419,900
Median Rent: $2,077/month
Median Listing-Price Change: -0.1% year over year
Olde Kensington sits between several established River Wards markets, including Fishtown and Northern Liberties. Its September 2026 housing data show a median listing price of $419,900, median rent of $2,077, and $271 per square foot.
Investment Profile
Listing price per square foot: about $271
Mix of industrial conversions and newer residential development
Close to Fishtown and Northern Liberties
Median listing prices remained roughly flat year over year
Why It Made the List
Olde Kensington provides exposure to an established redevelopment corridor while maintaining a different pricing profile from neighboring Fishtown and Northern Liberties.
Its relatively flat year-over-year listing-price movement also illustrates why individual properties are better evaluated using multiple factors rather than a single neighborhood appreciation statistic. Property condition, exact location, achievable rent, operating expenses, and acquisition price can all materially affect the investment profile.
6) Northern Liberties
Median Listing Price: $642,000
Median Sold Price: $569,500
Median Rent: $2,500/month
Northern Liberties occupies one of the highest current price tiers in this comparison. Its September 2026 housing data show a median listing price of $642,000, a median sold price of $569,500, and median rent of $2,500 per month.
Investment Profile
Listing price per square foot: about $345
Median days on market: 63
106 active sale listings
220 rental properties
Established mixed-use and residential development
Why It Made the List
Northern Liberties adds a higher-priced urban market to a Philadelphia comparison that otherwise includes several substantially lower-entry neighborhoods.
Its median listing price was up 12.49% year over year in September 2026, while the median sold price was up 19.64%. These figures describe recent market movement rather than an expected future rate of appreciation.
7) Port Richmond
3-Month Median Sale Price (through August 2026): $239,883
3-Month Median Sale-Price Change: +20.5% year over year
Median Days on Market: 61
Port Richmond has one of the lower current transaction-price benchmarks in this comparison. Its three-month sale price reached $239,883 through August 2026, up 20.5% from the comparable period a year earlier.
Investment Profile
Three-month median sale price: about $240,000
Median sale price per square foot: about $188
Traditional Philadelphia rowhouse housing stock
Close to Fishtown and East Kensington
Why It Made the List
Port Richmond provides a materially different acquisition-price profile from nearby Fishtown and Northern Liberties.
Neighborhood transaction mixes can change significantly between periods, so the recent 20.5% change is best read as movement in the three-month median sale-price measure rather than as an expected annual return.
8) Rittenhouse
Median Listing Price: $499,900
Median Sold Price: $672,500
Median Rent: $2,226/month
Rittenhouse represents a different segment of Philadelphia's housing market. The Center City neighborhood combines comparatively high price-per-square-foot values with substantial rental inventory.
Its September 2026 housing data show a median listing price of $499,900, a median sold price of $672,500, median rent of $2,226, and median listing price per square foot of $516.
Investment Profile
Listing price per square foot: about $516
181 active for-sale listings
246 rental properties
Central access to employment, retail, dining, and transit
Why It Made the List
Rittenhouse adds an established Center City market to a list otherwise weighted toward rowhouse neighborhoods and redevelopment corridors.
Its September data also illustrate the importance of separating rental and resale indicators. Median rent was up 4.65% year over year while the median listing price was down 15.62%, showing that rental and for-sale measures can move differently over the same period.
9) Passyunk Square
Median Listing Price (September 2026): $550,000
Median Sold Price (September 2026): $407,500
Median Rent: $1,950/month
Median Days on Market (September 2026): 65
Passyunk Square centers on East Passyunk Avenue and the surrounding South Philadelphia rowhouse blocks. September 2026 listing data show a median listing price of $550,000, a median sold price of $407,500, a $332 median listing price per square foot, and 65 median days on market. Realtor.com's dedicated neighborhood data continue to show a $1,950 median rent.
Investment Profile
Listing price per square foot: about $332
Median asking rent: $1,950
Median days on market: 65
Primarily rowhouse-oriented residential stock
Established commercial corridor along East Passyunk Avenue
Why It Made the List
East Passyunk Avenue adds a substantial neighborhood-scale commercial district to the surrounding residential market. The business district's 2026 materials describe 200+ businesses along the corridor, with independently owned restaurants, shops, and services forming a large part of the local commercial base.
Current pricing also places Passyunk Square firmly in the higher-priced half of this neighborhood comparison.
10) Logan Square
Median Listing Price (September 2026): $401,000
Median Sold Price (September 2026): $445,000
Median Rent: $2,395/month
Median Days on Market (September 2026): 79
Logan Square combines a Center City location with a substantial apartment and condominium component. September 2026 housing data show a median listing price of $401,000, a median sold price of $445,000, a $395 median listing price per square foot, and 79 median days on market. Realtor.com's dedicated neighborhood page shows a $2,395 median rent.
Investment Profile
Listing price per square foot: about $395
Median asking rent: $2,395
Median days on market: 79
Large apartment and condominium component
Central employment, transit, and cultural access
Why It Made the List
Logan Square's housing mix gives it a different market composition from lower-density Philadelphia rowhouse neighborhoods. Its Center City location also places residential properties near major employment, cultural, and transportation infrastructure.
The September listing and sold-price measures are both higher than the dedicated neighborhood page's August figures, while median rent remains $2,395. The monthly difference illustrates how listing and transaction medians can shift as the mix of available and completed properties changes.
Comparing Philadelphia Neighborhood Profiles
Philadelphia's neighborhoods occupy very different price and rental tiers.
Lower current price points include Port Richmond, where the three-month median sale price was approximately $240,000, and Brewerytown, where the median listing price was $285,750.
Mid-range markets include Point Breeze at a $345,000 median listing price, University City at $382,450, and Logan Square at $401,000. Differences in housing type and measurement period mean these values should still be compared in context.
Higher-priced neighborhoods include Fishtown at $475,000, Rittenhouse at $499,900, Passyunk Square at $550,000, and Northern Liberties at $642,000. Northern Liberties carries the highest current median listing price among these 10 neighborhoods.
The distinction between listing prices and sale prices matters. Median rents may also represent a different mix of properties from homes offered for sale. These figures work best as market benchmarks rather than direct return calculations.
How mogul Approaches Real Estate Investing
Buying an entire rental property generally concentrates capital in one asset while also involving financing, ongoing property operations, maintenance, and eventual disposition.
mogul uses a fractional real estate investment-club structure. Through its property investment process, selected properties are acquired through LLCs and fractionalized so members can hold interests tied to identifiable properties.
The platform handles property selection, underwriting, acquisition, and ongoing property operations, and less than 1% of reviewed properties pass its diligence process.
Current mogul Metrics
mogul's current company figures include:
The $110M asset figure is dated June 1, 2026, while the 50K+ users and 4.47% record monthly yield figures are dated September 28, 2026.
When a property generates distributable rental income, members may receive proportional monthly distributions based on the applicable ownership structure and property performance. mogul's current investment model describes a general property holding period of 3 to 10 years.
Qualifying new members may also be eligible for mogul's First $10K Protection. The promotion applies to qualifying investments made during a new member's first seven days, with mogul covering qualifying aggregate losses of up to $10,000 after the first year using its own balance-sheet capital, subject to the applicable promotion terms.
For property analysis, mogul provides an investment property calculator, rental property calculator, and Airbnb calculator for modeling individual U.S. addresses with adjustable assumptions.
Disclaimer: The information provided in this guide is for educational purposes only and does not constitute financial, tax, or legal advice. Always consult with a licensed professional before making any financial or investment decisions.
Frequently Asked Questions
Which Philadelphia neighborhoods have lower current price points?
Among the neighborhoods in this comparison, Brewerytown had a median listing price of $285,750 in August 2026, while Port Richmond's three-month median sale price was $239,883. These figures measure different parts of the housing market, so they are most useful as separate neighborhood benchmarks rather than directly interchangeable values.
How does fractional real estate investing work?
Fractional ownership allows multiple investors to acquire interests connected to an individual real estate asset rather than purchasing the entire property. With mogul, selected properties are acquired through LLC structures and fractionalized. The mogul investment structure can include proportional rental distributions, governance rights, applicable tax reporting, and proceeds from an eventual sale based on the relevant offering terms.
What returns can rental properties in Philadelphia generate?
There is no single return figure that applies across Philadelphia rental properties. Outcomes depend on acquisition price, achievable rent, occupancy, financing, taxes, insurance, maintenance, management costs, capital expenditures, and eventual sale value. Neighborhood price and rent changes provide useful market context for evaluating those property-level inputs.
What property taxes apply in Philadelphia?
Philadelphia's current tax rate is 1.3998% of assessed property value. The rate applies across tax years 2025 through 2029 under the city's current tax-rate schedule, while federal and state income-tax considerations vary by ownership structure and individual circumstances.
How can Philadelphia rental properties be compared?
A property-level comparison can consider acquisition price, achievable rent, vacancy assumptions, property taxes, insurance, financing costs, maintenance, capital expenditures, management expenses, and intended hold period. Neighborhood-level medians provide useful context, while mogul's real estate calculator can model adjustable assumptions for individual U.S. addresses.