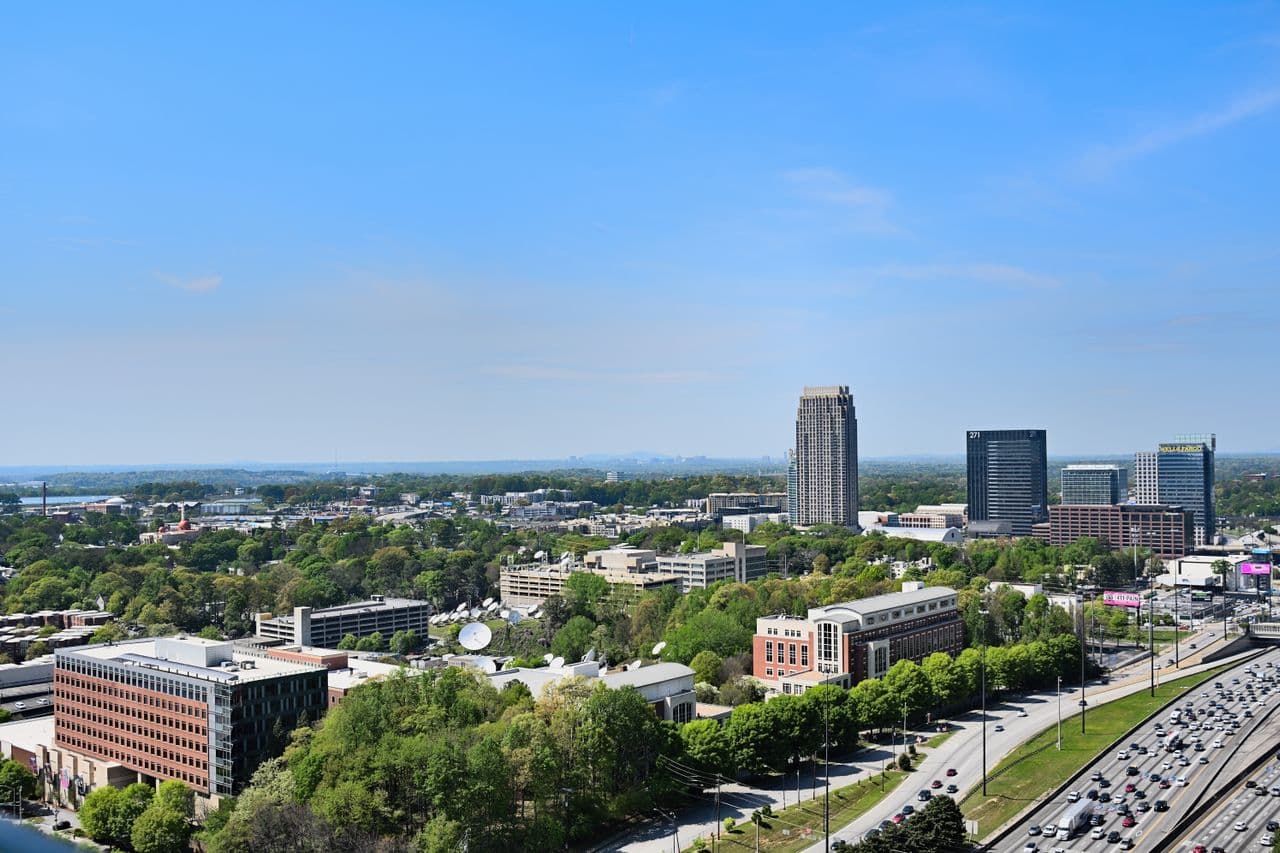
Durham gives you a wide range of housing markets to compare within one city. In September 2026, Durham's $419,999 median listing price accompanied a $422,000 median sold price, $1,666 median monthly rent, and 61 median days on market. Those citywide numbers only provide a starting point because pricing, rental inventory, housing type, and market pace can look very different from one Durham neighborhood to another.
The city's employment and education base adds another layer to that comparison. Research Triangle Park is home to more than 385 companies and 55,000 employees, while Duke University reported 17,325 students in fall 2025. You can consider those regional anchors alongside current neighborhood pricing, inventory, location, housing stock, and market activity as you compare Durham real estate opportunities.
Disclaimer: The information provided in this guide is for educational purposes only and does not constitute financial, tax, or legal advice. Always consult with a licensed professional before making any financial or investment decisions.
Key Takeaways
Durham's citywide median listing price is $419,999, with a $422,000 median sold price and $1,666 median monthly rent in September 2026
Neighborhood pricing varies substantially, from East Durham at $315,000 to Downtown Durham at $774,900 among the September neighborhood snapshots in this guide
Price-per-square-foot benchmarks also vary considerably, including $564 in Downtown Durham and $302 in Duke Park
Research Triangle Park remains a major regional employment center, with 55,000+ employees and 385+ companies
Market pace differs across neighborhoods, ranging from 53 median days in Trinity Park to 114 days in Downtown Durham among the September snapshots used here
Understanding Durham's Real Estate Market
Durham had 2,187 active listings and 4,043 rental properties in September 2026. The median listing price declined 5.63% year over year, while the median sold price increased 5.11%. Median rent increased 4.45%.
Durham includes downtown condominiums and mixed-use buildings, historic close-in neighborhoods, established single-family areas, and newer suburban communities. Those differences make neighborhood-level comparisons useful because a single citywide median combines several distinct types of inventory.
You can model property-level financing, rental income, operating expenses, and holding-period assumptions with mogul's investment property calculator.
1) Downtown Durham - Best for Central Urban Inventory
Best For: Condominiums, apartments, and mixed-use urban housing
Median Listing Price: $774,900
Median Sold Price: $701,500
Median Rent: $1,788/month
Median Days on Market: 114
Data Period: September 2026
Downtown Durham's $774,900 median listing price in September 2026 accompanied a $701,500 median sold price, median rent of $1,788 per month, and a $564 median listing price per square foot. The neighborhood had 44 active listings and 435 rental properties.
Downtown combines residential inventory with employment, restaurants, entertainment, and cultural destinations. Its housing stock includes condominiums, apartments, mixed-use properties, and redeveloped buildings in Durham's central business district.
Investment Drivers
Central urban location
Condominium, apartment, and mixed-use inventory
$564 median listing price per square foot
435 rental properties in September
Market Context
The median listing price increased 35.98% year over year in September, while the median sold price increased 1.01%. The median listing price per square foot declined 0.77% year over year, rental inventory increased 24.62%, and homes spent a median of 114 days on market, up 10.17% from a year earlier.
Investment Profile
Downtown Durham represents a higher-price, higher-density segment of the city. Its $774,900 median listing price and $564 median listing price per square foot place it well above Durham's citywide benchmarks, while its 435 rental properties give it a substantially larger rental inventory than many smaller residential neighborhoods.
2) Trinity Park - Best for Historic Housing Near Duke
Best For: Historic residential inventory near Duke University
Median Listing Price: $524,450
Median Sold Price: $755,000
Median Listing Price per Sq. Ft.: $402
Median Days on Market: 53
Active Listings: 8
Rental Properties: 4
Data Period: September 2026
Trinity Park's $524,450 median listing price in September 2026 accompanied a $755,000 median sold price and a $402 median listing price per square foot. The neighborhood had eight active listings, four rental properties, and a median market time of 53 days. The current source does not report a neighborhoodwide median rent.
The neighborhood sits near Duke's East Campus and contains established residential housing within close reach of central Durham.
Investment Drivers
Location near Duke University
Established residential housing
Compact current for-sale inventory
$402 median listing price per square foot
Market Context
The median listing price declined 34.03% year over year in September, while the median listing price per square foot increased 24.44%. Active listings declined 50% from a year earlier, and homes spent a median of 53 days on market, down 11.67% year over year. The September snapshot included just eight active listings and four rental properties, so changes in a small number of properties can materially affect neighborhoodwide figures.
Investment Profile
Trinity Park combines a close-in location with a median listing price above Durham's citywide benchmark. Its small current inventory makes property-level characteristics and comparable sales particularly important when evaluating individual listings.
3) Hope Valley - Best for Established Residential Housing
Best For: Established single-family residential inventory
Median Listing Price: $499,000
Median Sold Price: $492,500
Median Rent: $1,375/month
Median Days on Market: 61
Data Period: September 2026
Hope Valley's $499,000 median listing price in September 2026 accompanied a $492,500 median sold price, median rent of $1,375 per month, and a $236 median listing price per square foot. The neighborhood had 75 active listings and 57 rental properties.
Hope Valley is an established south Durham residential area with detached housing and long-standing neighborhood amenities. Its current listing-price benchmark sits above Durham's citywide median.
Investment Drivers
Established single-family housing
75 active listings in September
57 rental properties
South Durham location
Market Context
The median listing price increased 8.48% year over year, while the median sold price declined 1.99%. Median rent declined 1.79%, and homes spent a median of 61 days on market.
Investment Profile
Hope Valley provides a larger inventory base than several close-in historic neighborhoods, giving you more current listings to compare while still requiring property-level analysis of condition and rental economics.
4) Old West Durham - Best for Historic Urban Form Near Ninth Street
Best For: Close-in housing near Duke and Ninth Street
Median List Price: $557,500
Median Sale Price: $492,500
Average Price per Sq. Ft.: $388
Average Days on Market: 36
Homes for Sale: 8
Data Period: Current rolling market snapshot
Current Old West Durham housing data show a $557,500 median list price, a $492,500 median sale price, and an average price of $388 per square foot. Homes spend an average of 36 days on market, and the current dataset includes eight homes for sale. The median sale price over the latest 12-month period is 11% below the preceding 12-month period.
The neighborhood also falls within Durham's Neighborhood Protection Overlay, which establishes standards intended to maintain characteristics of established neighborhoods.
Investment Drivers
Proximity to Duke University and Ninth Street
Established close-in residential housing
$557,500 median list price in the current market snapshot
Neighborhood Protection Overlay standards
Market Context
The current $492,500 median sale price compares with a $557,500 median list price. Homes spend an average of 36 days on market, while the median sale price over the latest 12 months is down 11% from the prior 12-month period.
Investment Profile
Old West Durham combines a close-in location with an established residential housing stock. Because this source uses rolling market statistics rather than a September-only snapshot, its figures should be compared with the other neighborhood datasets with that reporting-period difference in mind.
5) Lakewood Park - Best for Varied Close-In Housing
Best For: Established close-in residential housing
Median Rent: $1,188/month
Active Listings: 7
Rental Properties: 10
Data Period: September 2026
Lakewood Park's $1,188 median monthly rent in September 2026 accompanied seven active listings and 10 rental properties.
Lakewood Park also sits within an area covered by Durham's Lakewood, West End, and Lyon Park Small Area Plan, which is intended to inform recommendations related to future development and public investment.
Investment Drivers
Close-in Durham location
Established residential housing
10 rental properties in September
Current small-area planning activity affecting parts of Lakewood Park
Market Context
Active listings increased 20% year over year to seven, while rental inventory declined 33.33% to 10 properties. Median rent was $1,188 per month, unchanged from August and down 3.34% year over year.
Investment Profile
Lakewood Park has a relatively small current for-sale and rental inventory compared with larger Durham submarkets. Because the September market summary does not publish a median listing price, sold price, price per square foot, or days-on-market figure, those metrics are not inferred from broader Durham data.
6) Duke Park - Best for Established Housing North of Downtown
Best For: Established residential housing near central Durham
Median Listing Price: $361,885
Median Sold Price: $545,000
Median Listing Price per Sq. Ft.: $302
Median Days on Market: 60
Active Listings: 21
Rental Properties: 5
Data Period: September 2026
Duke Park's $361,885 median listing price in September 2026 accompanied a $545,000 median sold price and a $302 median listing price per square foot. The neighborhood had 21 active listings, five rental properties, and a median market time of 60 days.
Duke Park is an established neighborhood north of downtown with older residential housing and access to central Durham.
Investment Drivers
$361,885 median listing-price benchmark
21 active listings in September
Established residential housing
Location near central Durham
Market Context
The median listing price declined 39.93% year over year in September, while the median sold price declined 14.51%. The median listing price per square foot increased 26.15% year over year to $302. Active listings increased 64.29% to 21, while homes spent a median of 60 days on market, up 15.24% from a year earlier. Rental inventory declined 50% year over year to five properties.
Investment Profile
Duke Park's September figures show a notable gap between the $361,885 median listing price and $545,000 median sold price, alongside a year-over-year increase in price per square foot. With 21 active listings and only five rental properties in the current snapshot, listing, sold-price, and inventory metrics provide more context here than an inferred neighborhoodwide rental benchmark.
7) Southpoint - Best for South Durham Suburban Access
Best For: Suburban housing near major commercial and transportation corridors
Median Listing Price: $450,000
Median Sold Price: $470,000
Median Rent: $1,439/month
Median Listing Price per Sq. Ft.: $210
Median Days on Market: 60
Active Listings: 45
Rental Properties: 154
Data Period: September 2026
Southpoint's $450,000 median listing price in September 2026 accompanied a $470,000 median sold price, median rent of $1,439 per month, and a $210 median listing price per square foot. The neighborhood had 45 active listings, 154 rental properties, and a median market time of 60 days.
Southpoint offers a suburban housing profile in south Durham near major commercial and transportation corridors.
Investment Drivers
South Durham location
154 rental properties in September
45 active listings
$450,000 median listing-price benchmark
Market Context
The median listing price declined 8.72% year over year in September, while the median sold price increased 13.07%. The median listing price per square foot declined 5.98% to $210. Active listings declined 8.33%, rental inventory declined 7.35%, and homes spent a median of 60 days on market, down 8.40% from a year earlier. Median rent increased 1.12% year over year to $1,439 per month.
Investment Profile
Southpoint's September data show a median sold price above its median listing price, alongside a $210 median listing price per square foot. With 45 active listings and 154 rental properties, its current inventory is broader than several of the smaller Durham neighborhoods in this guide.
8) East Durham - Best for Lower Current Listing Prices
Best For: Lower current listing-price benchmarks
Median Listing Price: $315,000
Median Rent: $1,800/month
Median Listing Price per Sq. Ft.: $242
Median Days on Market: 76
Active Listings: 14
Rental Properties: 12
Data Period: September 2026
East Durham's $315,000 median listing price in September 2026 accompanied median rent of $1,800 per month, a $242 median listing price per square foot, and 76 median days on market. The neighborhood had 14 active listings and 12 rental properties.
Among the neighborhoods in this guide with current dedicated pricing data, East Durham sits toward the lower end of the listing-price range.
Investment Drivers
$315,000 median listing price
$1,800 median rent in the current snapshot
Location east of central Durham
Older residential housing in many parts of the neighborhood
Market Context
The median listing price declined 10% year over year, while median rent increased 12.71%. Active listings doubled from the comparable period a year earlier but still totaled only 14 properties.
Investment Profile
East Durham provides a lower-price comparison within this guide. Its relatively small inventory makes property condition and immediate location particularly important when comparing individual addresses.
Comparing Durham Neighborhood Profiles
The available neighborhood data show distinct pricing tiers. Among the September snapshots with dedicated listing-price figures, East Durham sits at $315,000, followed by Duke Park at $361,885, Southpoint at $450,000, Hope Valley at $499,000, Trinity Park at $524,450, and Downtown Durham at $774,900. Old West Durham's separate rolling market snapshot reports a $557,500 median list price, while Lakewood Park's September market summary does not publish a listing-price figure.
Housing type also changes across those tiers. Downtown provides a denser urban market, while Trinity Park, Old West Durham, Duke Park, and Lakewood Park contain established close-in housing. Hope Valley and Southpoint provide more suburban residential profiles.
Rental benchmarks likewise differ. Durham's citywide median is $1,666 per month, while the neighborhood figures available in this guide range from Lakewood Park at $1,188 to East Durham at $1,800. Hope Valley is at $1,375, Southpoint at $1,439, and Downtown Durham at $1,788. Inventory size matters when interpreting those numbers, particularly in neighborhoods represented by relatively few rental properties.
Short-Term Rental Considerations in Durham
Durham's Unified Development Ordinance defines overnight accommodations as residential units arranged for stays of less than 30 days. The City's use regulations determine where different overnight-accommodation uses are permitted or subject to limited-use standards.
You can model property-level short-term rental assumptions such as nightly rates, occupancy, financing, and operating costs with mogul's Airbnb calculator. Regulatory treatment and projected economics should be considered separately.
How mogul Makes Property-Level Real Estate Investing More Accessible
mogul provides access to individual residential properties through a fractional ownership structure. Selected properties are purchased through property-specific LLCs, and ownership interests in those LLCs are fractionalized.
That structure gives you a way to access property-level real estate without purchasing an entire home yourself. Properties are generally held for 3 to 10 years under the current structure. Members may receive proportional monthly distributions when operations generate distributable income, along with applicable property-level tax allocations and proceeds from an eventual sale according to the governing terms and property performance.
What Sets mogul Apart
Institutional experience: The investment team has $10 billion deployed into real estate
Selective property review: Less than 1% of reviewed properties pass the diligence process
Property-level structure: Selected properties are held through individual LLCs
Professional operations: Property management is handled on behalf of members
Analysis tools: You can model individual U.S. addresses with mogul's property calculators
Current mogul Metrics
mogul's current public company figures include:
Assets on mogul: $110M
Users on mogul: 50K+
Record monthly yield: 4.47%
Target IRR range: 12-20%
Real estate deployed: $10 billion
The $110M asset figure is dated June 1, 2026, while the 50K+ users, 4.47% record monthly yield, and 12-20% target IRR range are dated September 28, 2026. The 4.47% figure is a historical record monthly yield, while 12-20% is a target range rather than a guaranteed outcome. Actual results vary by property and investment terms.
For property-level analysis, mogul also provides an investment property calculator, rental property calculator, Airbnb calculator, and real estate calculator.
Disclaimer: The information provided in this guide is for educational purposes only and does not constitute financial, tax, or legal advice. Always consult with a licensed professional before making any financial or investment decisions.
Frequently Asked Questions
What is the current median home price in Durham?
Durham's September 2026 market shows a $419,999 median listing price and a $422,000 median sold price. The citywide median rent is $1,666 per month, while homes spend a median of 61 days on market. Neighborhood figures differ because inventory, housing type, property condition, and location vary across Durham.
Which Durham neighborhoods in this guide have lower current price points?
Among the September neighborhood figures in this guide, East Durham has a $315,000 median listing price, followed by Duke Park at $361,885 and Southpoint at $450,000. These figures describe different housing inventories, so they provide neighborhood-level context rather than a direct measure of an individual property's potential return.
How do Research Triangle Park and Duke University relate to Durham's housing market?
Research Triangle Park reports more than 385 companies and 55,000 employees, while Duke University reported 17,325 students in fall 2025. Both are major parts of the Triangle's employment and education base and provide useful context when comparing locations and commuting patterns.
How does fractional real estate investing work?
Fractional real estate investing allows multiple investors to hold interests associated with an individual property rather than purchasing the entire asset themselves. Through mogul's ownership structure, selected properties are acquired through LLCs and ownership interests in those LLCs are fractionalized. Depending on the property and governing terms, the structure can include proportional monthly distributions, governance rights, applicable tax allocations, and proceeds from an eventual property sale.
What short-term rental rules apply in Durham?
Durham's Unified Development Ordinance defines overnight accommodations as residential units arranged for stays of less than 30 days. Permitted uses vary by zoning district under the City's use table, so short-term rental assumptions should be considered separately from the property's zoning and applicable use standards.