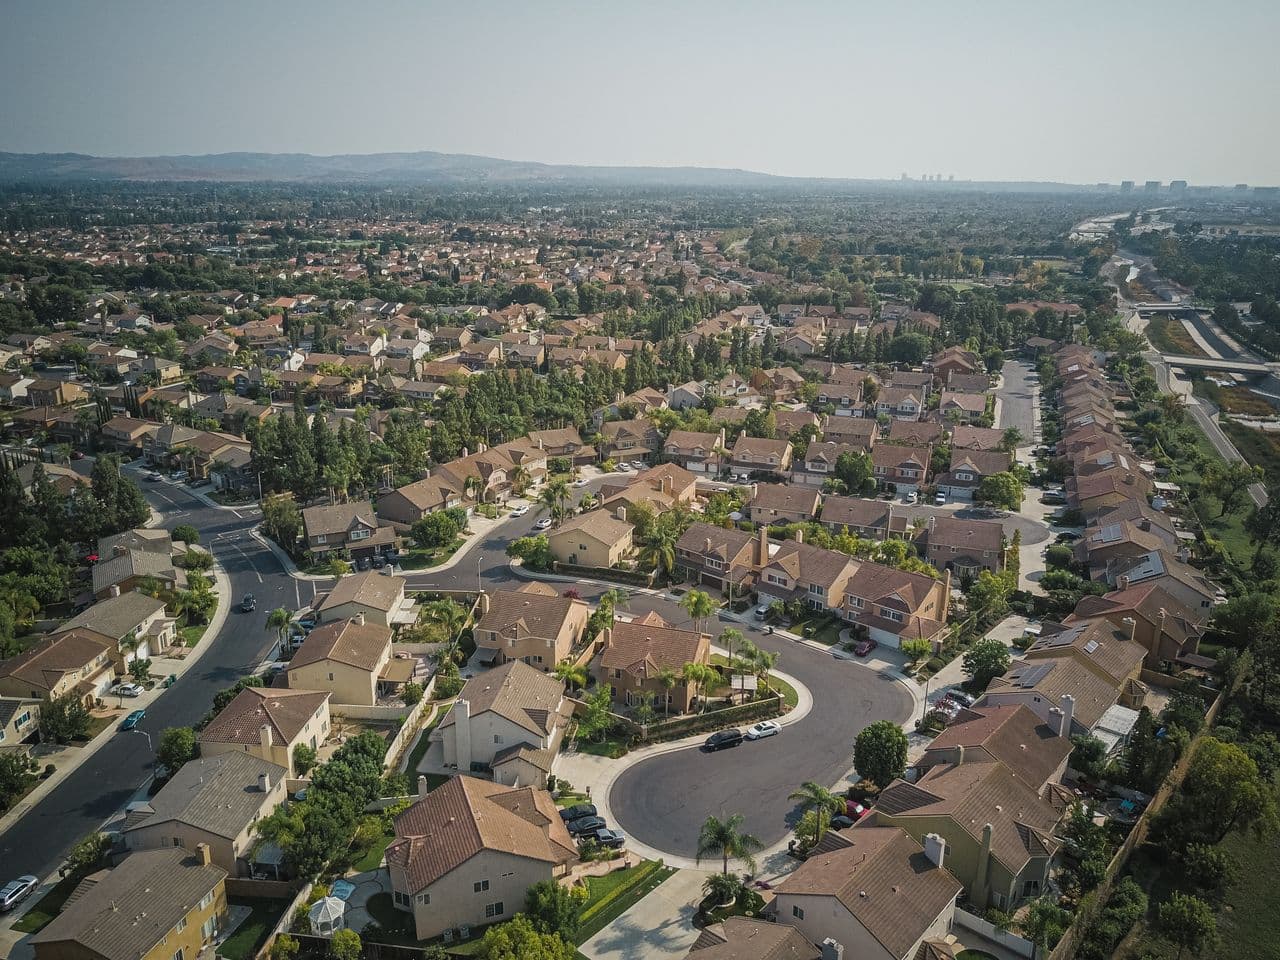
Arizona's real estate market is anything but uniform. Among the neighborhoods in this guide, current median listing prices range from $347,990 in Rita Ranch to $675,000 in Las Sendas, while rental inventory ranges from just nine properties in Cooper Commons to 1,602 in East Mesa. Those differences can materially change the type of property, price point, and rental market you're evaluating.
Arizona also ranked seventh among U.S. states for numeric population growth from July 2024 to July 2025, adding 67,394 residents during that period. Rather than treating Arizona as one investment market, this guide compares eight neighborhoods using current listing prices, rents, inventory, price per square foot, and market pace so you can see how the opportunities differ across the state.
Disclaimer: The information provided in this guide is for educational purposes only and does not constitute financial, tax, or legal advice. Always consult with a licensed professional before making any financial or investment decisions.
Key Takeaways
Rita Ranch has the lowest current median listing price among the neighborhoods in this guide, at $347,990 in September 2026
Las Sendas occupies the highest current listing-price tier, with a $675,000 median listing price and $3,200 median monthly rent
East Mesa has the largest rental inventory in this comparison, with 1,602 rental properties
Old Town Scottsdale also has substantial rental inventory, with 1,181 rental properties and a $2,194 median monthly rent
Market pace varies materially, from 39 median days on market in Cooper Commons to 87 days in Power Ranch
Understanding Arizona's Real Estate Market
Arizona's housing markets vary considerably across the Phoenix metropolitan area, Tucson, Scottsdale, Mesa, Gilbert, Chandler, Tempe, and Queen Creek. Even neighborhoods within the same city can show substantial differences in listing price, rent, inventory, and sales pace.
That makes neighborhood-level data more useful than relying exclusively on broad statewide averages. Property-level financing, rental income, operating expenses, and holding assumptions can also be modeled with mogul's investment property calculator.
1) East Mesa - Best for Broad Rental Inventory
Best For: Broad residential and rental inventory
Median Listing Price: $469,500
Median Sold Price: $468,500
Median Rent: $1,699/month
Median Listing Price per Sq. Ft.: $267
Median Days on Market: 60
Active Listings: 2,455
Rental Properties: 1,602
Data Period: September 2026
East Mesa's $469,500 median listing price in September 2026 accompanied a $468,500 median sold price, $1,699 median monthly rent, and $267 median listing price per square foot. The area had 2,455 active listings and 1,602 rental properties.
Investment Drivers
1,602 rental properties in September
2,455 active for-sale listings
$469,500 median listing price
Broad East Mesa residential inventory
Market Context
The median listing price declined 3.20% year over year, while the median sold price increased 2.88%. Rental inventory increased 20.87%, median rent increased 0.95%, and homes spent a median of 60 days on market.
Investment Profile
East Mesa provides one of the broadest datasets in this guide, with substantially more for-sale and rental inventory than the smaller master-planned and close-in neighborhoods covered below.
2) Rita Ranch - Best for Lower Current Listing Prices
Best For: Lower current listing-price benchmark
Median Listing Price: $347,990
Median Sold Price: $305,000
Median Rent: $1,897/month
Median Listing Price per Sq. Ft.: $204
Median Days on Market: 65
Active Listings: 103
Rental Properties: 62
Data Period: September 2026
Rita Ranch's $347,990 median listing price is the lowest among the neighborhoods in this guide with directly comparable listing-price data. September figures also show a $305,000 median sold price, $1,897 median rent, and $204 median listing price per square foot.
Investment Drivers
Lowest current listing-price benchmark in this guide
103 active listings
62 rental properties
$204 median listing price per square foot
Market Context
The median listing price increased 2.93% year over year, while the median sold price declined 7.01%. Rental inventory increased 93.75%, median rent declined 3.12%, and homes spent a median of 65 days on market.
Investment Profile
Rita Ranch offers a lower current listing-price benchmark than the Phoenix-area and Scottsdale neighborhoods in this comparison. Its current market also contains considerably more inventory than several of the smaller communities in the guide.
3) The Villages at Queen Creek - Best for Queen Creek Residential Inventory
Best For: Residential inventory within Queen Creek
Median Listing Price: $454,000
Median Sold Price: $510,000
Median Rent: $2,277/month
Median Listing Price per Sq. Ft.: $239
Median Days on Market: 83
Active Listings: 24
Rental Properties: 15
Data Period: September 2026
The Villages at Queen Creek's $454,000 median listing price in September 2026 accompanied a $510,000 median sold price, $2,277 median monthly rent, and $239 median listing price per square foot. The neighborhood had 24 active listings, 15 rental properties, and a median market time of 83 days.
Investment Drivers
Queen Creek location
$454,000 median listing-price benchmark
24 active listings
$2,277 median monthly rent
Market Context
The median listing price declined 2.16% year over year, while the median sold price increased 23.64%. The median listing price per square foot was nearly unchanged, declining 0.05%. Active listings increased 30%, rental inventory increased 37.50%, and homes spent a median of 83 days on market, up 127.40% from a year earlier. Median rent increased 3.50% year over year.
Investment Profile
The Villages at Queen Creek provides a neighborhood-specific view of the broader Queen Creek market. With 24 active listings and 15 rental properties in the September snapshot, its inventory remains relatively compact, so individual property characteristics can materially affect neighborhood-level comparisons.
4) Las Sendas - Best for Higher-Price East Mesa Housing
Best For: Higher-price residential inventory in Mesa
Median Listing Price: $675,000
Median Sold Price: $712,500
Median Rent: $3,200/month
Median Listing Price per Sq. Ft.: $290
Median Days on Market: 77
Active Listings: 51
Rental Properties: 21
Data Period: September 2026
Las Sendas' $675,000 median listing price in September 2026 accompanied a $712,500 median sold price, $3,200 median monthly rent, and $290 median listing price per square foot. The neighborhood had 51 active listings, 21 rental properties, and a median market time of 77 days.
Investment Drivers
Higher-price Mesa residential segment
$3,200 median monthly rent
51 active listings
$290 median listing price per square foot
Market Context
The median listing price declined 9.99% year over year, while the median sold price increased 6.74%. The median listing price per square foot declined 4.14% to $290. Active listings declined 21.54%, rental inventory declined 35.48%, and homes spent a median of 77 days on market, down 25.29% from a year earlier. Median rent declined 8.57% year over year to $3,200 per month.
Investment Profile
Las Sendas occupies the highest current listing-price tier among the eight neighborhoods in this guide. Its $675,000 median listing price and $3,200 median monthly rent distinguish it from Mesa's broader residential market, while the September snapshot includes 51 active listings and 21 rental properties.
5) Cooper Commons - Best for Smaller Chandler Inventory
Best For: Smaller residential inventory in Chandler
Median Listing Price: $488,000
Median Sold Price: $480,000
Median Rent: $2,202/month
Median Listing Price per Sq. Ft.: $258
Median Days on Market: 39
Active Listings: 14
Rental Properties: 9
Data Period: September 2026
Cooper Commons' $488,000 median listing price in September 2026 accompanied a $480,000 median sold price, $2,202 median monthly rent, and $258 median listing price per square foot. The neighborhood had 14 active listings, nine rental properties, and a median market time of 39 days.
Investment Drivers
Chandler location
39 median days on market
$2,202 median monthly rent
Compact current for-sale and rental inventories
Market Context
The median listing price declined 1.41% year over year, while the median sold price increased 15.66%. The median listing price per square foot declined 3.48% to $258. Active listings increased 50% from a year earlier, while rental inventory declined 25%. Homes spent a median of 39 days on market, down 59.69% year over year, and median rent declined 2.13% to $2,202 per month.
Investment Profile
Cooper Commons remains one of the smaller markets in this comparison. With 14 active listings and nine rental properties in the September snapshot, changes in a relatively small number of properties can materially affect neighborhood-level medians.
6) Power Ranch - Best for Gilbert Rental Inventory
Best For: Established Gilbert residential and rental inventory
Median Listing Price: $499,900
Median Sold Price: $517,000
Median Rent: $2,068/month
Median Listing Price per Sq. Ft.: $243
Median Days on Market: 87
Active Listings: 37
Rental Properties: 67
Data Period: September 2026
Power Ranch's $499,900 median listing price in September 2026 accompanied a $517,000 median sold price, $2,068 median monthly rent, and $243 median listing price per square foot. The neighborhood had 37 active listings, 67 rental properties, and a median market time of 87 days.
Investment Drivers
Gilbert location
67 rental properties
37 active listings
$499,900 median listing-price benchmark
Market Context
The median listing price declined 5.68% year over year, while the median sold price declined 8.50%. The median listing price per square foot declined 2.41% to $243. Active listings declined 21.82%, while rental inventory declined 17.14%. Homes spent a median of 87 days on market, up 10.13% year over year, while median rent increased 11.78% to $2,068 per month.
Investment Profile
Power Ranch combines a $499,900 median listing price with a relatively broad rental inventory of 67 properties. Its September snapshot shows higher median rent than the prior year alongside fewer active and rental listings, giving it a different current inventory profile from several of the smaller Arizona neighborhoods in this guide.
7) Old Town Scottsdale - Best for Large Urban Rental Inventory
Best For: Urban housing with substantial rental inventory
Median Listing Price: $525,000
Median Sold Price: $600,000
Median Rent: $2,194/month
Median Listing Price per Sq. Ft.: $363
Median Days on Market: 80
Active Listings: 607
Rental Properties: 1,181
Data Period: September 2026
Old Town Scottsdale's $525,000 median listing price accompanied a $600,000 median sold price, $2,194 median rent, and $363 median listing price per square foot in September 2026. The neighborhood had 607 active listings and 1,181 rental properties.
Investment Drivers
1,181 rental properties
607 active listings
$363 median listing price per square foot
Central Scottsdale urban setting
Market Context
The median listing price declined 16% year over year, while the median sold price increased 12.15%. Median rent increased 3.34%, rental inventory was nearly unchanged from a year earlier, and homes spent a median of 80 days on market.
Investment Profile
Old Town has one of the broadest rental markets in this comparison. Its rental inventory is substantially larger than the smaller Chandler, Gilbert, Queen Creek, and Mesa neighborhoods covered here.
8) Downtown Tempe - Rio Salado - Best for Central Tempe Rentals
Best For: Central Tempe urban housing and rental inventory
Median Listing Price: $465,000
Median Sold Price: $431,687
Median Rent: $1,694/month
Median Listing Price per Sq. Ft.: $362
Median Days on Market: 80
Active Listings: 135
Rental Properties: 483
Data Period: September 2026
Downtown Tempe - Rio Salado's $465,000 median listing price in September 2026 accompanied a $431,687 median sold price, $1,694 median monthly rent, and $362 median listing price per square foot. The neighborhood had 135 active listings, 483 rental properties, and a median market time of 80 days.
Investment Drivers
Central Tempe location
483 rental properties
135 active listings
$362 median listing price per square foot
Market Context
The median listing price declined 8.95% year over year, while the median sold price declined 10.99%. The median listing price per square foot declined 1.02% to $362. Active listings increased 43.24% from a year earlier, while rental inventory declined 8.43%. Homes spent a median of 80 days on market, up 0.61% year over year, and median rent declined 1.97% to $1,694 per month.
Investment Profile
Downtown Tempe - Rio Salado combines one of the larger rental inventories in this guide with a comparatively high $362 median listing price per square foot. Its September snapshot includes 483 rental properties and 135 active listings, giving it a broader current inventory base than several of the smaller Arizona neighborhoods in this comparison.
Comparing Arizona Neighborhood Profiles
The September 2026 snapshots show a wide pricing range. Rita Ranch sits at $347,990, followed by The Villages at Queen Creek at $454,000, Downtown Tempe - Rio Salado at $465,000, East Mesa at $469,500, Cooper Commons at $488,000, Power Ranch at $499,900, Old Town Scottsdale at $525,000, and Las Sendas at $675,000.
Rental inventory also varies substantially. East Mesa had 1,602 rental properties, followed by Old Town Scottsdale at 1,181 and Downtown Tempe - Rio Salado at 483. At the other end of the range, Cooper Commons had nine rental properties, The Villages at Queen Creek had 15, and Las Sendas had 21.
Market pace shows another meaningful difference. Cooper Commons had the shortest median market time in this group at 39 days, followed by East Mesa at 60, Rita Ranch at 65, Las Sendas at 77, Old Town Scottsdale and Downtown Tempe - Rio Salado at 80, The Villages at Queen Creek at 83, and Power Ranch at 87 days.
How mogul Makes Property-Level Real Estate Investing More Accessible
mogul provides access to individual residential properties through a fractional ownership structure. Selected properties are purchased through property-specific LLCs, and ownership interests in those LLCs are fractionalized.
Properties are generally held for 3 to 10 years under the current structure. Members may receive proportional monthly distributions when operations generate distributable income, along with applicable property-level tax allocations, governance rights, and proceeds from an eventual property sale according to the governing terms and property performance.
What Sets mogul Apart
Institutional experience: The investment team has $10 billion deployed into real estate
Selective property review: Less than 1% of reviewed properties pass the diligence process
Property-level structure: Selected properties are acquired through individual LLCs before ownership interests are fractionalized
Multi-year structure: Properties are generally held for 3 to 10 years
Property analysis: You can evaluate individual addresses with mogul's adjustable real estate calculators
For property-level modeling, mogul provides an investment property calculator, rental property calculator, Airbnb calculator, and real estate calculator.
Disclaimer: The information provided in this guide is for educational purposes only and does not constitute financial, tax, or legal advice. Always consult with a licensed professional before making any financial or investment decisions.
Frequently Asked Questions
Which Arizona neighborhood in this guide has the lowest current listing price?
Rita Ranch has the lowest directly comparable median listing price in this guide at $347,990 as of September 2026. The Villages at Queen Creek follows at $454,000, Downtown Tempe - Rio Salado at $465,000, and East Mesa at $469,500.
Which neighborhoods have the largest rental inventories?
Among the selected areas, East Mesa has 1,602 rental properties, followed by Old Town Scottsdale at 1,181 and Downtown Tempe - Rio Salado at 483. At the smaller end of the September snapshots, Cooper Commons has nine rental properties and The Villages at Queen Creek has 15.
Which neighborhood is in the highest current price tier?
Las Sendas has the highest median listing price among the eight neighborhoods in this guide at $675,000. Its September 2026 snapshot also shows a $712,500 median sold price, $3,200 median monthly rent, and $290 median listing price per square foot.
How does fractional real estate investing work?
Fractional real estate investing allows multiple investors to hold interests associated with an individual property rather than purchasing the entire asset themselves. Through mogul's ownership structure, selected properties are acquired through property-specific LLCs and ownership interests in those LLCs are fractionalized. Property-specific terms determine distributions, governance rights, tax allocations, and eventual sale proceeds.
What should you compare when evaluating an Arizona rental property?
Neighborhood-level listing prices and rents provide useful context, but an individual property's economics also depend on acquisition price, financing, property taxes, insurance, operating expenses, expected rent, vacancy assumptions, maintenance, and holding period. Neighborhood snapshots should therefore be used as context rather than as a substitute for property-level underwriting.