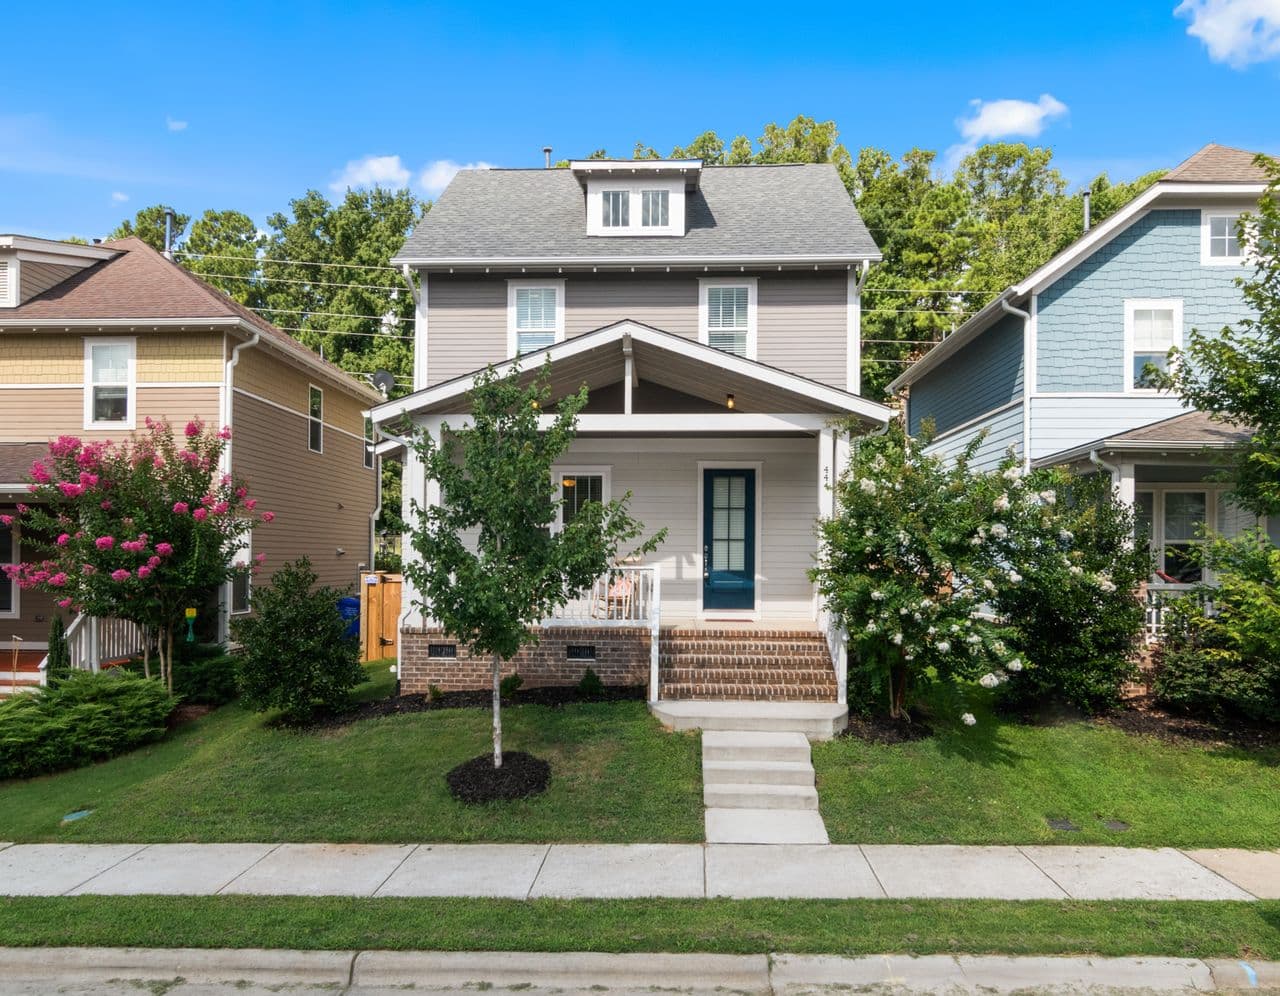
Current data on home-price appreciation, single-family rental growth, operating fundamentals, and housing demand
Equity appreciation occurs when a property's market value increases, raising the value of the ownership interest associated with the property. In single-family rentals, real estate appreciation is distinct from rental income: property values, rents, occupancy, financing, and operating performance can move differently even when they influence the same investment.
Current 2026 data shows U.S. single-family home values continuing to rise nationally, while appreciation varies significantly by region. Single-family rents are also increasing, though at different rates across price tiers and metropolitan markets. The trends below separate property-value appreciation from the rental and operating conditions that provide context for the sector.
Disclaimer: The information provided in this guide is for educational purposes only and does not constitute financial, tax, or legal advice. Always consult with a licensed professional before making any financial or investment decisions.
Key Takeaways
U.S. single-family home prices increased 2.6% year over year in July 2026
National single-family rents increased 1.8% year over year in July 2026
In June, 75.7% of markets tracked in one SFR analysis recorded monthly rent increases
SFR cap rates reached a 7.4% cap rate in Q1 2026
Build-to-rent accounted for 6.9% of starts during the year ending in Q2 2026
Home-Price Appreciation in 2026
1. U.S. single-family home prices increased 2.6% year over year in July 2026
National house prices recorded a 2.6% annual increase between July 2025 and July 2026. The FHFA House Price Index tracks changes in single-family home values using repeat-sale data drawn from properties across all 50 states and hundreds of U.S. cities.
For SFR analysis, the figure provides a current national reference point for property-value appreciation. Individual rental properties can experience different value changes depending on market conditions, property characteristics, improvements, and local supply and demand.
2. U.S. home prices increased 0.3% from June to July 2026
On a seasonally adjusted basis, national house prices posted a 0.3% monthly increase in July.
Monthly changes tend to be more volatile than annual comparisons, but the July reading shows that national prices continued moving upward after the index was unchanged in June. Shorter-term data is useful for identifying changes in momentum while longer periods provide a broader view of appreciation.
3. House prices increased 2.1% between Q2 2025 and Q2 2026
The quarterly index recorded a 2.1% annual increase between the second quarters of 2025 and 2026. Prices also increased 0.3% from Q1 to Q2 2026.
Quarterly data smooths some of the month-to-month variation found in housing markets. For SFR properties, it provides another national benchmark for comparing individual market appreciation with the wider single-family housing environment.
4. House prices increased in 46 states and the District of Columbia
Appreciation remained geographically broad during the second quarter, with prices rising in 46 states and D.C. between Q2 2025 and Q2 2026.
Only four states recorded annual declines during the period. The broad distribution of positive changes shows why national appreciation figures provide useful context but cannot substitute for market-level analysis when evaluating an individual rental property.
5. Alaska recorded 8.3% annual home-price appreciation
Among states, Alaska posted the strongest Q2 annual increase at 8.3% annual appreciation.
Vermont followed at 7.3%, while Hawaii increased 5.8%. Illinois and West Virginia each recorded 5.6% growth. These differences show how significantly property-value trends can vary even within a national market that is appreciating overall.
6. The Middle Atlantic recorded 6.3% annual appreciation in July
At the census-division level, the Middle Atlantic division recorded the strongest 12-month home-price growth at 6.3% in July 2026.
The division includes New York, New Jersey, and Pennsylvania. Its appreciation rate was more than twice the 2.6% national increase, illustrating the degree to which regional housing conditions can differ from a nationwide average.
7. The Mountain division recorded 0.6% annual appreciation
The Mountain division posted the smallest annual increase among the nine census divisions in July, with prices rising 0.6%.
That still represented positive year-over-year appreciation. The spread between 0.6% in the Mountain division and 6.3% in the Middle Atlantic reinforces the importance of separating national housing trends from property-specific local conditions.
8. National house prices are up 33.41% over five years
FHFA's Q2 2026 purchase-only index shows five-year national appreciation of approximately 33.41%.
The longer measurement period puts recent annual changes into perspective. A five-year figure captures several different market environments, while an individual property's appreciation can differ from the national index based on its location, physical condition, purchase price, and local housing supply.
Single-Family Rent Growth
9. Single-family rents increased 1.8% year over year in July 2026
U.S. single-family rent prices recorded 1.8% annual rent growth in July 2026.
Rent growth is separate from equity appreciation because it measures changes in rental prices rather than changes in the property's market value. For rental properties, however, rents remain an important operating measure because they influence property income and can affect valuation assumptions.
10. High-priced single-family rentals recorded 2.6% rent growth
Higher-priced rentals posted 2.6% high-end growth year over year in July 2026.
The increase was stronger than the national SFR average and illustrates how rental performance can vary by price tier. Cumulative rent trends can also look different over longer periods, making both recent momentum and multi-year changes relevant when comparing market segments.
11. Low-priced single-family rentals recorded 0.6% annual growth
At the other end of the pricing spectrum, lower-priced properties recorded 0.6% low-end growth in July.
The gap between lower- and higher-priced rental growth widened during the period. That variation shows why a national rental average can mask differences in tenant markets, local supply, price points, and property characteristics.
12. Detached single-family rental prices increased 1.9%
Detached rentals recorded 1.9% detached growth year over year in July 2026, slightly ahead of the 1.7% increase recorded for attached rentals.
Although the difference is relatively small, it highlights the variation that can exist within the SFR category itself. Detached homes and attached properties can serve different renter groups and operate in different supply environments.
13. Another SFR index recorded 2.9% annual rent growth in June
A separate SFR market analysis measured 2.9% annual rent growth nationally in June 2026.
This figure differs from the 1.8% July reading above because the studies use different source data, methodologies, and measurement periods. The comparison is useful because it shows why rent statistics should be interpreted within the methodology of the index that produced them rather than treated as interchangeable measurements.
Regional SFR Rent Trends
14. All 50 largest metros recorded positive SFR rent growth in the first half of 2026
Rents increased across all 50 large metros analyzed between December 2025 and June 2026.
The direction was consistent across the largest markets even though the size of the increase varied substantially. That distinction is important when comparing SFR locations because positive national or metropolitan growth does not mean every market is moving at the same pace.
15. Buffalo recorded 3.6% SFR rent growth
Buffalo led the 50 largest metropolitan areas with 3.6% rent growth during the first half of 2026.
The result contributed to a broader pattern in which several Northeast and Midwest markets ranked near the top of the SFR rent-growth table. It also demonstrates that some of the faster current rent increases are occurring outside the Sun Belt markets that attracted significant attention earlier in the decade.
16. San Jose recorded 3.3% rent growth
San Jose ranked second with 3.3% rent growth between December 2025 and June 2026.
The market reached that position despite having a very different pricing profile from Buffalo. The contrast provides another example of why regional rent growth can emerge from different combinations of supply, household demand, employment conditions, and existing rental costs.
17. Cincinnati and Hartford each recorded 2.7% rent growth
Cincinnati and Hartford tied for third among the largest metropolitan areas with 2.7% rent growth during the first half of 2026.
New York and Philadelphia followed at 2.6%, while Chicago recorded 2.5%. In total, eight of the 10 fastest-growing large SFR markets in the analysis were located in the Northeast or Midwest.
18. 75.7% of tracked markets recorded monthly rent increases in June
Of 602 markets analyzed, 456 posted month-over-month rent increases in June, bringing the share with rising rents to 75.7% of markets.
That was the highest share recorded during 2026 through June and was up from 69.4% in December. The figure measures the breadth of rent increases rather than their size, providing a different view of SFR rental conditions than the national growth rate alone.
Operating Fundamentals and Supply
19. SFR occupancy averaged 93.9% in Q1 2026
National SFR 93.9% occupancy was recorded during the first quarter of 2026.
That level was close to the 94.1% average recorded between 2015 and 2019. Occupancy measures how much of the rental stock is occupied and provides operating context for SFR income, but it should remain distinct from appreciation, which describes changes in property value.
20. SFR cap rates reached 7.4% in Q1 2026
Single-family rental cap rates increased to a 7.4% cap rate in the first quarter of 2026.
A cap rate relates property-level net operating income to property value, making it a pricing and income-yield metric rather than a direct measure of appreciation. Changes in cap rates can nevertheless provide useful context for how SFR income and property valuations relate to one another.
21. SFR cap rates increased roughly 210 basis points from their 2021 low
By Q1 2026, cap rates had risen approximately 210 basis points from their recent low of about 5.3% in late 2021.
The increase represents a material repricing in SFR property-level yields over several years. Because cap rates and property values interact with income, financing, and transaction pricing, the trend adds useful context alongside direct house-price appreciation data.
22. Build-to-rent accounted for 6.9% of single-family housing starts
During the year ending in Q2 2026, build-to-rent properties represented 6.9% of starts across single-family construction.
That was below the 9.0% peak recorded in Q3 2024 but remained well above the 2.2% historical average for 1975 through 2011. Build-to-rent supply matters to the SFR market because new construction can alter rental availability and competitive conditions within individual markets.
23. Build-to-rent starts totaled 63,000 units over the previous 12 months
Approximately 63,000 BTR starts were recorded in the 12 months ending June 2026.
That was down from the recent peak of 92,000 starts in Q3 2024, reflecting a normalization in new development after an unusually active construction period. The level remained above every four-quarter total recorded before 2022, leaving BTR as a meaningful component of new SFR supply.
Housing Access and Rental-Market Context
24. First-time buyers represented 21% of home buyers
First-time purchasers accounted for 21% of buyers in the 2026 Home Buyers and Sellers Generational Trends report.
That was the lowest share since the measure began in 1981. Homeownership and SFR investing are separate markets, but the buyer share provides useful context for the housing environment in which rental households and single-family rental properties operate.
25. The U.S. homeownership rate was 65.0% in Q2 2026
The national 65.0% homeownership rate in Q2 2026 was essentially unchanged from the same quarter a year earlier.
The remaining household population includes renters across apartments, single-family homes, and other housing types. For SFR analysis, the figure provides broad demand context rather than a direct forecast of rents, occupancy, or property appreciation in any particular market.
How mogul Approaches Single-Family Rental Investing
mogul provides fractional access to individual real estate properties through a property-specific ownership structure. Selected properties are purchased through LLCs, and ownership interests in those LLCs are fractionalized. Properties are generally structured around multi-year holding periods, with property-level economics tied to the applicable ownership terms and operating performance.
The investment team has $10 billion deployed into real estate, and less than 1% of reviewed properties pass the platform's diligence process. Its underwriting framework incorporates market research, property analysis, acquisition review, financing, rental assumptions, and internal investment evaluation before a property is selected.
mogul also applies a 12% minimum IRR hurdle to projected property returns, inclusive of applicable one-time fees. The hurdle is part of the platform's underwriting framework, while property appreciation remains one component of the broader assumptions that can contribute to a property's projected economics.
For additional property-level analysis, mogul provides an investment property calculator, rental property calculator, and Airbnb calculator. These tools allow assumptions such as property price, rental income, financing, expenses, and holding period to be viewed across different scenarios.
Disclaimer: The information provided in this guide is for educational purposes only and does not constitute financial, tax, or legal advice. Always consult with a licensed professional before making any financial or investment decisions.
Frequently Asked Questions
What is equity appreciation in a single-family rental?
Equity appreciation refers to the increase in an owner's property equity that can result when the market value of the property rises. Equity can also change as mortgage principal is repaid. Appreciation is therefore different from rent growth, which describes changes in the amount tenants pay to occupy the property.
How is rent growth different from property appreciation?
Rent growth measures changes in rental prices, while appreciation measures changes in a property's market value. The two can influence the economics of the same rental property but do not necessarily move at the same rate. In July 2026, for example, national single-family rents increased 1.8% year over year, while FHFA measured a 2.6% annual increase in single-family home prices.
What factors can influence SFR property appreciation?
Property values can be affected by local housing supply, buyer demand, employment, population trends, financing conditions, interest rates, property condition, neighborhood characteristics, and comparable sales. Because those factors vary by location, national appreciation data is most useful as market context rather than a property-specific projection.
What do current 2026 SFR rent trends show?
Current indexes continue to show positive national rent growth, although the exact rate varies by methodology and reporting month. Cotality measured 1.8% annual growth in July, while an Arbor-Chandan analysis measured 2.9% in June. Regional differences remain significant, with several Northeast and Midwest metros among the faster-growing markets during the first half of the year.
How does mogul evaluate single-family rental properties?
mogul's property selection process incorporates market research, property-level analysis, acquisition review, financing assumptions, and internal investment evaluation. Less than 1% of reviewed properties pass the diligence process, and selected opportunities are screened against a 12% minimum projected IRR hurdle as part of the platform's underwriting framework.